Introduction
It is time for another development component review. Last June, I reviewed the Aspose.Email for .NET component and demonstrated how to work with email messages in PST files or via IMAP. Well, I am back again for a look at another Aspose package. This one is Aspose.Cells for .NET.
Aspose.Cells provides full access to hundreds of Excel file features without the need to install or distribute Microsoft Excel.
Aspose.Cells Features
For a full list of features visit the Aspose.Cells site. Here is a summary of some of the highlights.
File Manipulation
There are so many file formats supported by Aspose.Cells including Excel (XLS, XLSM, etc.), HTML, CSV, Tab Delimited and PDF. Developers can open/save files, encrypt saved files, convert Excel documents to PDF or even save a worksheets as a SVG file. You can also manipulate the file properties of existing Excel files.
Need to capture part of a workbook into an image file? There are APIs available to export Charts and entire Worksheets to an image, which can then be saved or manipulated like any other bitmap in .NET.
Worksheets, Rows and Columns
Aspose.Cells has Worksheet APIs to add and remove worksheets from workbooks. New worksheets can also be added to an existing PDF file with these APIs. Within a sheet, developers can manipulate scrollbar visibility, tabs, zoom factor as well as freezing and splitting panes on a sheet.
You can also take advantage of the APIs for working with rows and columns on a sheet. Your application can insert, delete, copy, hide/unhide, and adjust height/width.
Data and Formatting
Aspose.Cells can import data into worksheets from many different sources, including:
- Arrays and ArrayLists
- Custom .NET Objects and Collections
- DataTable / DataView / DataColumn
- Manual Data Entry
Once data is in a worksheet, it can be sorted, accessed and searched upon.
Cells includes a formula engine which can run with formulas embedded in existing spreadsheets or with new formulas created at runtime.
Think of any kind of data formatting you can perform in a cell in Excel, and you can probably do it with these APIs… fonts, colors, text formatting… you name it.
Tables and Charts
Lists can easily be formatted as tables on a worksheet with Aspose.Cells. Once part of a table, the data can be styled, formatted, grouped, and summed.
Charts are one of the most powerful features in Excel and Aspose.Cells. I’ll be showing an example of the charting API in my sample application below. Additional features not shown in my app include 3D formatting, inserting controls into charts (labels, pictures, textboxes), and Excel Sparklines.
Multi-Platform Support
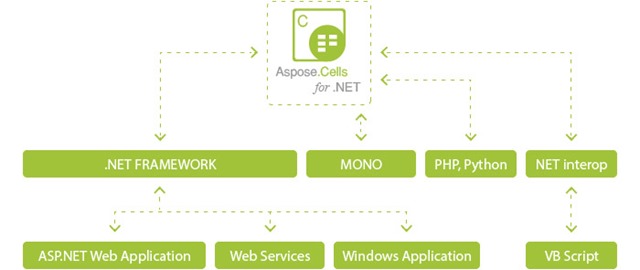
Not only are there tons of features in the Aspose.Cells library, but you can access those features from all of these platforms:
- .NET Framework
- PHP
- Python
- Mono

Sample App – Data and Pivots and Charts, Oh My!
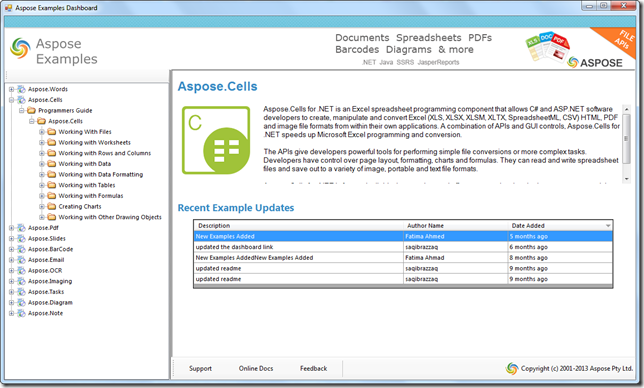
Just like the last time I started out working on an application with Aspose, I immediately cracked open the Examples Dashboard to find out how to implement the features I needed for my app.

Other NuGet Packages
I used a couple of other NuGet packages to help make my application development a little bit simpler.
MVVM Light – This is my go-to MVVM helper framework. It makes binding and messaging a breeze in WPF and other XAML applications.
CsvHelper – This package provides handy APIs for working with CSV files. Because I wanted to import my data from a CSV file into a .NET collection. I could have imported the CSV data directly with Aspose.Cells, but I wanted to see how the library worked with collections in case my data was coming from another source like a REST service or other API.
The App
The application itself is relatively simple. I first load some data from a CSV file which contains a list of sites and authors and the number of visits each had during a particular quarter. I load this into a List<AuthorSummary> collection with CsvHelper and import the collection to a sheet in a workbook I create in memory with Aspose.Cells.
// The path to the documents directory.
_dataDir = Path.GetFullPath("../../../Data/");

// Create directory if it is not already present.
bool IsExists = Directory.Exists(_dataDir);
if (!IsExists)
    Directory.CreateDirectory(_dataDir);

//Instantiating a Workbook object
_workbook = new Workbook();

//Obtaining the reference of the default first worksheet by passing its sheet index
Worksheet worksheet = _workbook.Worksheets[0];

var authorSummaries = new List<AuthorSummary>();

using (var csv = new CsvReader(new StreamReader("SitesChartSample.csv"), new CsvHelper.Configuration.CsvConfiguration { HasHeaderRecord = true, Delimiter = "," }))
{
    while (csv.Read())
    {
        var authorSummary = new AuthorSummary
                            {
                                Site = csv.GetField<string>(0),
                                Author = csv.GetField<string>(1),
                                Visits = csv.GetField<int>(2),
                                Quarter = csv.GetField<string>(3)
                            };

        authorSummaries.Add(authorSummary);
    }
}

var options = new ImportTableOptions { InsertRows = true };

worksheet.Cells.ImportCustomObjects(authorSummaries, 1, 0, options);
The next step is to create a pivot table. I want a better visualization of the number of visits each site is getting per quarter, but I still want to see the breakdown by author. I add a new PivotTable object with Aspose.Cells and point it to the range of cells to use as the source data. I then tell it which of the fields to use as the pivot Rows, Columns and Data.
Aspose.Cells.Pivot.PivotTableCollection pivotTables = worksheet.PivotTables;
int index = pivotTables.Add("=A2:D26", "F2", "VisitsBySiteAndQuarter");

//Accessing the instance of the newly added PivotTable
Aspose.Cells.Pivot.PivotTable pivotTable = pivotTables[index];

//Unshowing grand totals for rows.
pivotTable.RowGrand = false;

//Dragging the first field to the row area.
pivotTable.AddFieldToArea(Aspose.Cells.Pivot.PivotFieldType.Row, 0);
pivotTable.AddFieldToArea(Aspose.Cells.Pivot.PivotFieldType.Row, 1);

//Dragging the second field to the column area.
pivotTable.AddFieldToArea(Aspose.Cells.Pivot.PivotFieldType.Column, 3);

//Dragging the third field to the data area.
pivotTable.AddFieldToArea(Aspose.Cells.Pivot.PivotFieldType.Data, 2);

pivotTable.CalculateData();
The final step is to create a chart based on the summary data in the pivot table. I use Aspose.Cells to add a new Chart object to the worksheet and then add each series of data elements that is to be part of the chart.
//Adding a chart to the worksheet
int chartIndex = worksheet.Charts.Add(Aspose.Cells.Charts.ChartType.Pyramid, 2, 12, 14, 18);

//Accessing the instance of the newly added chart
Aspose.Cells.Charts.Chart chart = worksheet.Charts[chartIndex];

//Adding SeriesCollections (chart data sources) to the chart
chart.NSeries.Add("H10:K10", false);
chart.NSeries[0].Name = "C#";
chart.NSeries.Add("H16:K16", false);
chart.NSeries[1].Name = "VB";
chart.NSeries.Add("H20:K20", false);
chart.NSeries[2].Name = "F#";
chart.NSeries.Add("H31:K31", false);
chart.NSeries[3].Name = "JavaScript";

chart.Title.Text = "Quarterly Visits By Site";
One last bit I threw in was some styling/formatting. I wanted to see how easily I could change the appearance of a chart. Most of this code is taken from one of the samples in the Examples Dashboard application installed with Aspose.Cells.
private void SetChartAppearance(Aspose.Cells.Charts.Chart chart)
{
    //Setting the foreground color of the plot area
    chart.PlotArea.Area.ForegroundColor = Color.Blue;

    //Setting the foreground color of the chart area
    chart.ChartArea.Area.ForegroundColor = Color.Yellow;

    //Setting the foreground color of the 1st SeriesCollection area
    chart.NSeries[0].Area.ForegroundColor = Color.Red;

    //Setting the foreground color of the area of the 1st SeriesCollection point
    chart.NSeries[0].Points[0].Area.ForegroundColor = Color.Cyan;

    //Filling the area of the 2nd SeriesCollection with a gradient
    chart.NSeries[3].Area.FillFormat.SetOneColorGradient(Color.Lime, 1, Aspose.Cells.Drawing.GradientStyleType.Horizontal, 1);

    //Get the CellsColor of SolidFill
    CellsColor cc = chart.NSeries[0].Area.FillFormat.SolidFill.CellsColor;

    //Create a theme in Accent style
    cc.ThemeColor = new ThemeColor(ThemeColorType.Accent6, 0.6);

    //Apply the them to the series
    chart.NSeries[0].Area.FillFormat.SolidFill.CellsColor = cc;
}
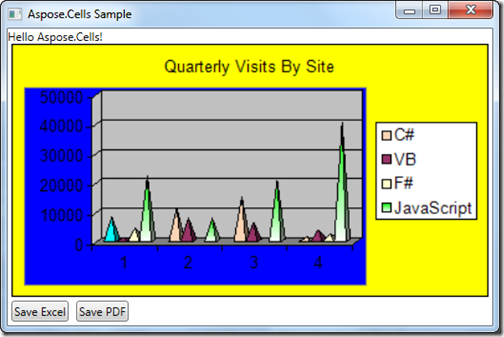
And here is the output of the chart when exported to an image and displayed on my WPF form:

Ok, so I’m no graphic designer. I am a developer after all.
Exporting Charts and Saving Files
When the WPF form loads and the ViewModel prepares the data for the chart, it then exports the chart to a Bitmap object which gets converted to a BitmapSource which can be bound to a WPF Image control on the form. I found this handy image conversion code on StackOverflow.
ChartImage = LoadBitmap(chart.ToImage());

[DllImport("gdi32")]
private static extern int DeleteObject(IntPtr o);

private static BitmapSource LoadBitmap(Bitmap image)
{
    IntPtr pointer = image.GetHbitmap();
    BitmapSource bitmapSource;

    try
    {
        bitmapSource = System.Windows.Interop.Imaging.CreateBitmapSourceFromHBitmap(pointer,
           IntPtr.Zero, Int32Rect.Empty,
           BitmapSizeOptions.FromEmptyOptions());
    }
    finally
    {
        DeleteObject(pointer);
    }

    return bitmapSource;
}
Two buttons on the form are bound to commands to save the workbook as either an Excel file (.xls) or PDF document. The code to perform each of these actions is similar and very intuitive. I also added some code to launch each file after saving so I could view the results.
private void SavePDF()
{
    //Save in Pdf format
    _workbook.Save(_dataDir + "book1.pdf", SaveFormat.Pdf);

    Process.Start(_dataDir + "book1.pdf");
}

private void SaveXLS()
{
    //Saving the Excel file
    _workbook.Save(_dataDir + "book1.xls");

    Process.Start(_dataDir + "book1.xls");
}
The full source code for this project can be found here. The trial Aspose.Cells product is fully functional but adds watermarks to all of the files created.
Summary
If you are in the market for a library to give your spreadsheet application a jump-start, Aspose.Cells should be at the top of your list. I found the APIs really intuitive and the documentation and examples are thorough and comprehensive. I have really enjoyed my second experience with an Aspose product.
Happy Coding!
Disclosure of Material Connection: I received one or more of the products or services mentioned above for free in the hope that I would mention it on my blog. Regardless, I only recommend products or services I use personally and believe my readers will enjoy. I am disclosing this in accordance with the Federal Trade Commission’s 16 CFR, Part 255: “Guides Concerning the Use of Endorsements and Testimonials in Advertising.”
 You Have to Fucking Eat: Adam Mansbach, Owen Brozman: 9781617753787: Books


 3D Game Programming for Kids: Create Interactive Worlds with JavaScript (Pragmatic Programmers): Chris Strom: 9781937785444: Books